Rでggplot2を使用して多数のデータセットをプロットしています。プロットを比較しやすくするために、yスケールの制限を設定していますが、プロットの「自然な上部」の上には何もプロットされていません。 。
例:このプロットの場合:(
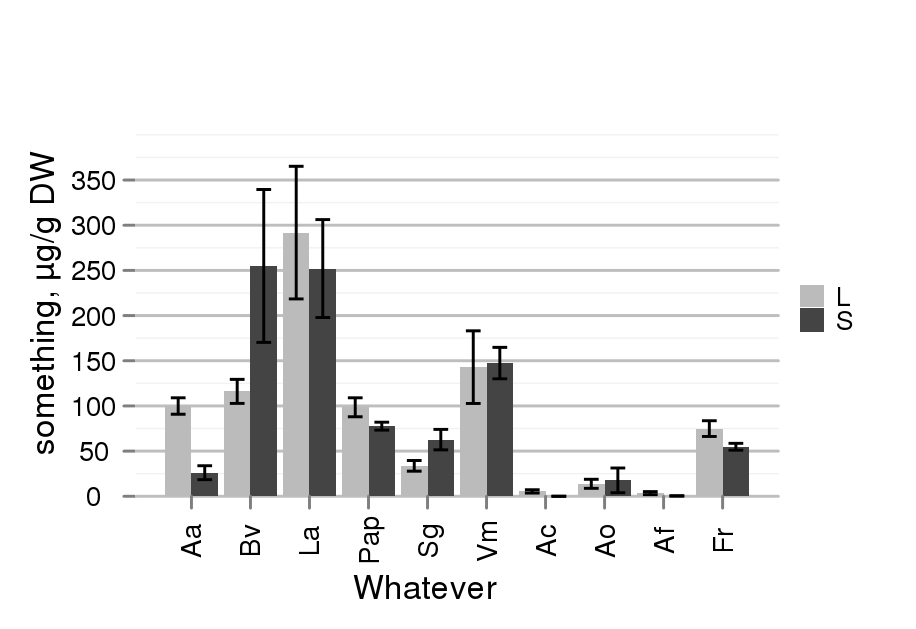
ソース:sickel.net)
上部のy値を500に設定しようとしましたが(上部の空白を見ると、なんとかできました)、ggplotで400、450、500のラベルと対応するグリッド線もプロットする方法はありますか?
データはデータフレームdfにあり、データとしてdf$datasetとdf$errorとエラーレベルがあります。私のプロットコードは現在
max = max(df$dataset + df$error) * 1.05
if(max > 300) max=505

dataplot = ggplot(data=df, aes(x=species,y=dataset,fill=dim,ylim=c(0,max)))
dataplot = dataplot+geom_bar(position=position_dodge())
dataplot = dataplot+scale_fill_manual(values=c("#BBBBBB", "#444444"))
dataplot = dataplot + ylab(ylab) + xlab(xlab) + opts(legend.title=theme_blank())

limits <- aes(ymax = df$dataset+df$error, ymin=df$dataset-df$error)
dodge = position_dodge(width=0.9)

dataplot = dataplot + geom_errorbar(limits, position=dodge, width=0.5)
dataplot = dataplot + opts(panel.background = theme_rect(fill='white', colour='white'))
dataplot = dataplot + opts(panel.grid.major = theme_line(colour = "gray"))

# dataplot = dataplot + coord_cartesian(ylim=c(0, max))
# dataplot = dataplot + scale_y_continuous(limits=c(0, max))

dataplot = dataplot +
               opts(axis.text.x = theme_text(colour = "black",angle=90),
                    axis.text.y = theme_text(colour = "black"))
dataplot = dataplot + opts(legend.key.size = unit(0.3, "cm"))
print(dataplot)
コメントアウトされた行からわかるように、私はcoord_cartesian、scale_y_continous、および現在のy-limを運がなく試しました(はい、coord_cartesianがズームインしていることを知っています)
