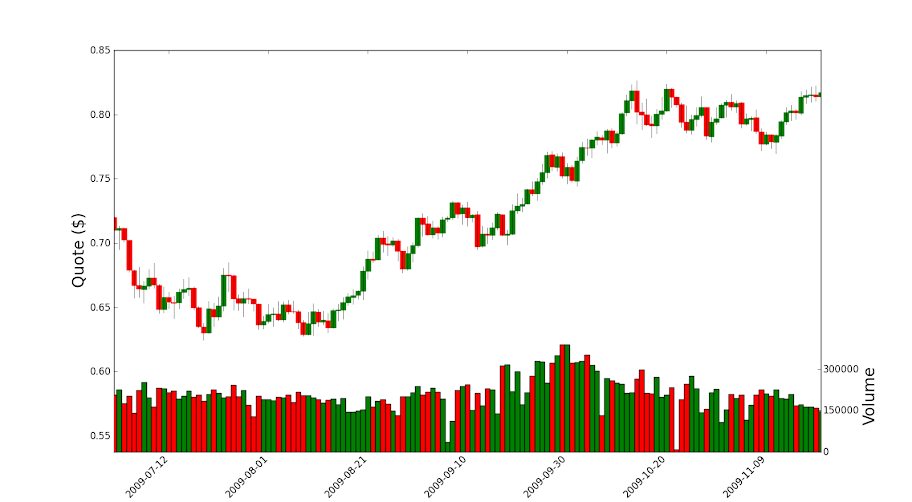
volume_overlay3が機能しませんでした。そこで、ローソク足プロットに棒グラフを追加するというあなたのアイデアを試しました。
ボリュームのツイン軸を作成した後、この軸を再配置し(短くします)、衝突を避けるためにローソク足のyデータの範囲を変更します。
import numpy as np
import matplotlib
import matplotlib.pyplot as plt
# from matplotlib.finance import candlestick
# from matplotlib.finance import volume_overlay3
# finance module is no longer part of matplotlib
# see: https://github.com/matplotlib/mpl_finance
from mpl_finance import candlestick_ochl as candlestick
from mpl_finance import volume_overlay3
from matplotlib.dates import num2date
from matplotlib.dates import date2num
import matplotlib.mlab as mlab
import datetime

datafile = 'data.csv'
r = mlab.csv2rec(datafile, delimiter=';')

# the dates in my example file-set are very sparse (and annoying) change the dates to be sequential
for i in range(len(r)-1):
    r['date'][i+1] = r['date'][i] + datetime.timedelta(days=1)

candlesticks = zip(date2num(r['date']),r['open'],r['close'],r['max'],r['min'],r['volume'])

fig = plt.figure()
ax = fig.add_subplot(1,1,1)

ax.set_ylabel('Quote ($)', size=20)
candlestick(ax, candlesticks,width=1,colorup='g', colordown='r')

# shift y-limits of the candlestick plot so that there is space at the bottom for the volume bar chart
pad = 0.25
yl = ax.get_ylim()
ax.set_ylim(yl[0]-(yl[1]-yl[0])*pad,yl[1])

# create the second axis for the volume bar-plot
ax2 = ax.twinx()


# set the position of ax2 so that it is short (y2=0.32) but otherwise the same size as ax
ax2.set_position(matplotlib.transforms.Bbox([[0.125,0.1],[0.9,0.32]]))

# get data from candlesticks for a bar plot
dates = [x[0] for x in candlesticks]
dates = np.asarray(dates)
volume = [x[5] for x in candlesticks]
volume = np.asarray(volume)

# make bar plots and color differently depending on up/down for the day
pos = r['open']-r['close']<0
neg = r['open']-r['close']>0
ax2.bar(dates[pos],volume[pos],color='green',width=1,align='center')
ax2.bar(dates[neg],volume[neg],color='red',width=1,align='center')

#scale the x-axis tight
ax2.set_xlim(min(dates),max(dates))
# the y-ticks for the bar were too dense, keep only every third one
yticks = ax2.get_yticks()
ax2.set_yticks(yticks[::3])

ax2.yaxis.set_label_position("right")
ax2.set_ylabel('Volume', size=20)

# format the x-ticks with a human-readable date.
xt = ax.get_xticks()
new_xticks = [datetime.date.isoformat(num2date(d)) for d in xt]
ax.set_xticklabels(new_xticks,rotation=45, horizontalalignment='right')

plt.ion()
plt.show()

data.csvはここにあります:http:
//pastebin.com/5dwzUM6e


