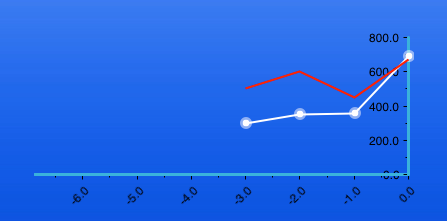
折れ線グラフを描こうとしています。しかし、メジャーグリッドラインを描くことはできません。x 軸ラベルをカスタムすると、メジャーグリッドラインがすべて表示されません。そして、y 軸ラベルを非表示にする方法。ここに私の折れ線グラフがあります: ここにリンクの説明を入力してください
次のように描くのを手伝ってください: ここにリンクの説明を入力してください
- 主グリッド線
- xaxis ラベルをカスタマイズし、yaxis ラベルを非表示にします。感謝。
これが私のコードです:
    NSAutoreleasePool *pool = [[NSAutoreleasePool alloc] init];

CGRect bounds = layerHostingView.bounds;

// Create the graph and assign the hosting view.
graph = [[CPTXYGraph alloc] initWithFrame:bounds];
layerHostingView.hostedGraph = graph;
[graph applyTheme:theme];

graph.plotAreaFrame.masksToBorder = NO;

// chang the chart layer orders so the axis line is on top of the bar in the chart.
NSArray *chartLayers = [[NSArray alloc] initWithObjects:[NSNumber numberWithInt:CPTGraphLayerTypePlots],
                        [NSNumber numberWithInt:CPTGraphLayerTypeMajorGridLines],
                        [NSNumber numberWithInt:CPTGraphLayerTypeMinorGridLines],
                        [NSNumber numberWithInt:CPTGraphLayerTypeAxisLines],
                        [NSNumber numberWithInt:CPTGraphLayerTypeAxisLabels],
                        [NSNumber numberWithInt:CPTGraphLayerTypeAxisTitles],
                        nil];
graph.topDownLayerOrder = chartLayers;
[chartLayers release];


// Add plot space for horizontal bar charts
graph.paddingLeft = 50.0;
graph.paddingTop = 25.0;
graph.paddingRight = 50.0;
graph.paddingBottom = 60.0;


// Setup plot space
CPTXYPlotSpace *plotSpace = (CPTXYPlotSpace *)graph.defaultPlotSpace;
plotSpace.allowsUserInteraction = YES;
plotSpace.delegate = self;
plotSpace.xRange = [CPTPlotRange plotRangeWithLocation:CPTDecimalFromFloat(0) length:CPTDecimalFromFloat(7)];
plotSpace.yRange = [CPTPlotRange plotRangeWithLocation:CPTDecimalFromFloat(0) length:CPTDecimalFromFloat(1000)];

// Setup grid line style
CPTMutableLineStyle *majorXGridLineStyle = [CPTMutableLineStyle lineStyle];
majorXGridLineStyle.lineWidth = 1.0f;
majorXGridLineStyle.dashPattern =  CPTLinearBlendingMode;
majorXGridLineStyle.lineColor = [CPTColor colorWithComponentRed:64/255.0 green:177/255.0 blue:219/255.0 alpha:1.0];


// Setup x-Axis.
CPTXYAxisSet *axisSet = (CPTXYAxisSet *)graph.axisSet;
CPTXYAxis *x = axisSet.xAxis;
x.majorGridLineStyle = majorXGridLineStyle;
x.preferredNumberOfMajorTicks = 7;
x.majorIntervalLength = CPTDecimalFromString(@"1");
x.minorTicksPerInterval = 1;
x.labelRotation =  M_PI/4;
x.visibleRange = [CPTPlotRange plotRangeWithLocation:CPTDecimalFromFloat(0.0f) length:CPTDecimalFromFloat(-7.0f)];
x.gridLinesRange = [CPTPlotRange plotRangeWithLocation:CPTDecimalFromFloat(0.0f) length:CPTDecimalFromFloat(-7.0f)];
x.labelingPolicy = CPTAxisLabelingPolicyNone;
NSMutableArray *labels = [[NSMutableArray alloc] initWithCapacity:[xAxisWeek count]];
int idx = 0;
for (NSString *week in xAxisWeek)
{
    CPTAxisLabel *label = [[CPTAxisLabel alloc] initWithText:week textStyle:x.labelTextStyle];
    label.tickLocation = CPTDecimalFromInt(idx);
    label.offset = 5.0f;
    label.rotation = M_PI/4;
    [labels addObject:label];
    [label release];
    idx--;
}
x.axisLabels = [NSSet setWithArray:labels];
[labels release];


// Setup y-Axis.
CPTMutableLineStyle *majorYGridLineStyle = [CPTMutableLineStyle lineStyle];
majorYGridLineStyle.lineWidth = 1.0f;
majorYGridLineStyle.dashPattern =  CPTLinearBlendingMode;
majorYGridLineStyle.lineColor = [CPTColor colorWithComponentRed:87/255.0 green:142/255.0 blue:242/255.0 alpha:1.0];

CPTXYAxis *y = axisSet.yAxis;
y.majorGridLineStyle = majorYGridLineStyle;
y.majorIntervalLength = CPTDecimalFromString(@"200");
y.minorTicksPerInterval = 1;
y.visibleRange = [CPTPlotRange plotRangeWithLocation:CPTDecimalFromFloat(0.0f) length:CPTDecimalFromFloat(1000.0f)];
y.gridLinesRange = [CPTPlotRange plotRangeWithLocation:CPTDecimalFromFloat(0.0f) length:CPTDecimalFromFloat(-1000.0f)];