寄付データにリンクされている C# のグラフを作成しています。毎週、合計寄付額がテーブルに記録されます。チャートはそれらの数値を引き出し、折れ線グラフでグラフ化します。
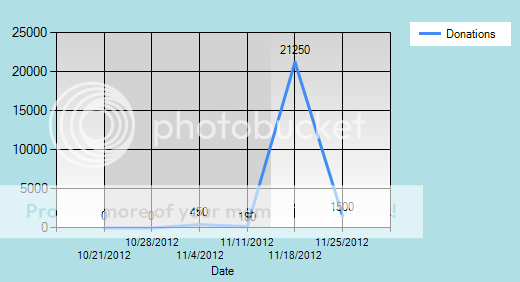
私が抱えている問題は、毎週が曜日として記録されているため、週に基づいて機能するはずのコントロールが正しく機能していないことです。コードと結果の写真を以下に添付しました。
ここの各データ ポイントが曜日として表示されている理由を知りたいです。それは私がデータをロードしている方法ですか?
あなたが与えることができるどんな助けにも感謝します.
これが私のコードです:
        #region Chart4
        string DonationSelect = this.DonationSelect.SelectedValue;
        Time = Convert.ToInt32(DonationSelect);

        if (Time > 3)
            Chart4.Series[0].IsValueShownAsLabel = false;
        else
            Chart4.Series[0].IsValueShownAsLabel = true;

        Chart4.Series[0].ChartType = SeriesChartType.Line;
        Chart4.ChartAreas["ChartArea1"].AxisX.IsMarginVisible = true;

        StartDate = GetNextDay(DateTime.Today, DayOfWeek.Sunday);
        TargetDate = GetNextDay(StartDate.AddMonths(-1 * Time), DayOfWeek.Sunday);

        for (DateTime i = TargetDate; i <= DateTime.Now; i = i.AddDays(7))
        {
            int Donations = 0;
            var oDonation = oDatabase.ExecuteScalar(@"SELECT Offering FROM
            tblStats WHERE Date=@Date",
                "Date", i);

            if (oDonation != null && oDonation != DBNull.Value)
            {
                Donations = Convert.ToInt32(oDonation);
            }
            //int Attendance = Convert.ToInt32();

            string Date = i.ToShortDateString();

            Chart4.Series[0].Points.AddXY(Date, Donations);
        }

        StripLine StripLine = new StripLine();

        StripLine.BackColor = Color.LightGray;
        StripLine.Interval = 1;
        StripLine.IntervalType = DateTimeIntervalType.Weeks;
        StripLine.StripWidth = .5;
        StripLine.StripWidthType = DateTimeIntervalType.Weeks;
        StripLine.IntervalOffset = 0;
        StripLine.IntervalOffsetType = DateTimeIntervalType.Days;

        Chart4.Legends.Add(new Legend("Legend3"));
        Chart4.Series[0].Legend = "Legend3";
        Chart4.Series[0].IsVisibleInLegend = true;
        Chart4.Series[0].LegendText = "Donations";
        Chart4.BorderSkin.SkinStyle = BorderSkinStyle.Emboss;
        Chart4.BackColor = Color.PowderBlue;
        Chart4.Series[0].BorderWidth = 3;
        Chart4.Series[0].BorderColor = Color.Orange;
        Chart4.ChartAreas["ChartArea1"].AxisX.Title = "Date";
        Chart4.ChartAreas["ChartArea1"].BackColor = Color.LightGray;
        Chart4.ChartAreas["ChartArea1"].BackSecondaryColor = Color.White;
        Chart4.ChartAreas["ChartArea1"].BackGradientStyle = GradientStyle.TopBottom;
        Chart4.ChartAreas["ChartArea1"].AxisX.StripLines.Add(StripLine);
        #endregion