私はZedGraphを使用しています
http://www.codeproject.com/Articles/5431/A-flexible-charting-library-for-NET?fid=26087&fr=11#xx0xx
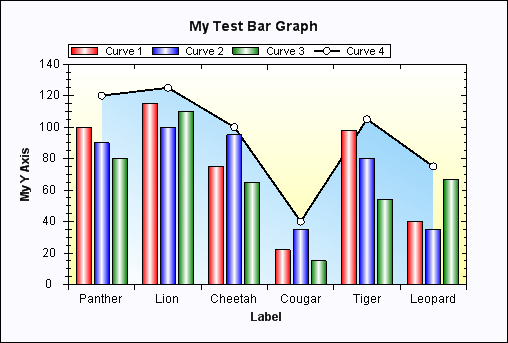
垂直バーをプロットしてから、プロット領域全体に水平線を配置したいと考えています。
バーの端までしか行かないようです!
この効果を実現するために、いくつかの x 軸と y 軸の値を追加しようとしましたが、うまくいきません。
出来ますか?
これが私のコードです:
    private void CreateGraph( ZedGraphControl zgc )
    {
        // get a reference to the GraphPane
        GraphPane myPane = zg1.GraphPane;

        // Set the Titles
        myPane.Title.Text = "My Test Bar Graph";
        myPane.XAxis.Title.Text = "Label";
        myPane.YAxis.Title.Text = "My Y Axis";

        // Make up some random data points
        string[] labels = { "Panther", "Lion" };
        double[] y = { 100, 115 };
        double[] x = {0, 900 };
        double[] y4 = { 90, 90};

        // Generate a black line with "Curve 4" in the legend
        LineItem myCurve = myPane.AddCurve("Curve 4", x, y4, Color.Black, SymbolType.Circle);

        // Generate a red bar with "Curve 1" in the legend
       BarItem myBar = myPane.AddBar("Curve 1", null, y, Color.Red);
       myBar.Bar.Fill = new Fill(Color.Red, Color.White, Color.Red);

        // Fix up the curve attributes a little
        myCurve.Symbol.Size = 8.0F;
        myCurve.Symbol.Fill = new Fill(Color.White);
        myCurve.Line.Width = 2.0F;

        // Fix up the curve attributes a little
        myCurve.Symbol.Size = 8.0F;
        myCurve.Symbol.Fill = new Fill(Color.White);
        myCurve.Line.Width = 2.0F;

        // Draw the X tics between the labels instead of
        // at the labels
        myPane.XAxis.MajorTic.IsBetweenLabels = true;

        // Set the XAxis labels
        myPane.XAxis.Scale.TextLabels = labels;
        // Set the XAxis to Text type
        myPane.XAxis.Type = AxisType.Text;

        // Fill the Axis and Pane backgrounds
        myPane.Chart.Fill = new Fill(Color.White, Color.FromArgb(255, 255, 166), 90F);
        myPane.Fill = new Fill(Color.FromArgb(250, 250, 255));

        // Tell ZedGraph to refigure the
        // axes since the data have changed
        zg1.AxisChange();
    }