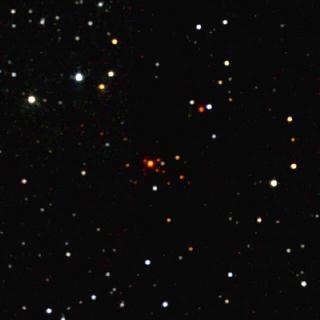
以下のような画像で、最も明白なクラスタリングの中心pythonにできるだけ近づけようとしています。

以前の質問で、2 次元配列のグローバル最大値とローカル最大値を取得する方法を尋ねたところ、与えられた回答は完全に機能しました。問題は、最大のビンのグループではなく最大のビンのみを考慮しているため、さまざまなビンのサイズで取得したグローバルな最大値を平均することで取得できる中心の推定が、目で設定したものよりも常にわずかにずれていることです。 (目で見るように)。
この質問に対する答えを私の問題に適応させようとしましたが、私の画像はノイズが多すぎてそのアルゴリズムが機能しないことがわかりました。その答えを実装する私のコードは次のとおりです。
import numpy as np
from scipy.ndimage.filters import maximum_filter
from scipy.ndimage.morphology import generate_binary_structure, binary_erosion
import matplotlib.pyplot as pp

from os import getcwd
from os.path import join, realpath, dirname

# Save path to dir where this code exists.
mypath = realpath(join(getcwd(), dirname(__file__)))
myfile = 'data_file.dat'

x, y = np.loadtxt(join(mypath,myfile), usecols=(1, 2), unpack=True)
xmin, xmax = min(x), max(x)
ymin, ymax = min(y), max(y)

rang = [[xmin, xmax], [ymin, ymax]]
paws = []

for d_b in range(25, 110, 25):
    # Number of bins in x,y given the bin width 'd_b'
    binsxy = [int((xmax - xmin) / d_b), int((ymax - ymin) / d_b)]

    H, xedges, yedges = np.histogram2d(x, y, range=rang, bins=binsxy)
    paws.append(H)


def detect_peaks(image):
    """
    Takes an image and detect the peaks usingthe local maximum filter.
    Returns a boolean mask of the peaks (i.e. 1 when
    the pixel's value is the neighborhood maximum, 0 otherwise)
    """

    # define an 8-connected neighborhood
    neighborhood = generate_binary_structure(2,2)

    #apply the local maximum filter; all pixel of maximal value
    #in their neighborhood are set to 1
    local_max = maximum_filter(image, footprint=neighborhood)==image
    #local_max is a mask that contains the peaks we are
    #looking for, but also the background.
    #In order to isolate the peaks we must remove the background from the mask.

    #we create the mask of the background
    background = (image==0)

    #a little technicality: we must erode the background in order to
    #successfully subtract it form local_max, otherwise a line will
    #appear along the background border (artifact of the local maximum filter)
    eroded_background = binary_erosion(background, structure=neighborhood, border_value=1)

    #we obtain the final mask, containing only peaks,
    #by removing the background from the local_max mask
    detected_peaks = local_max - eroded_background

    return detected_peaks


#applying the detection and plotting results
for i, paw in enumerate(paws):
    detected_peaks = detect_peaks(paw)
    pp.subplot(4,2,(2*i+1))
    pp.imshow(paw)
    pp.subplot(4,2,(2*i+2) )
    pp.imshow(detected_peaks)

pp.show()
そして、これがその結果です(ビンサイズを変えます):

明らかに、私のバックグラウンドはノイズが多すぎてそのアルゴリズムが機能しないため、問題は、そのアルゴリズムの感度を下げるにはどうすればよいかということです。代替ソリューションが存在する場合は、お知らせください。
編集
Bi Rico のアドバイスに従って、次のように、2 次元配列を極大値ファインダーに渡す前に平滑化を試みました。
H, xedges, yedges = np.histogram2d(x, y, range=rang, bins=binsxy)
H1 = gaussian_filter(H, 2, mode='nearest')
paws.append(H1)
これらは、sigma2、4、および 8 の結果です。

編集2
Amode ='constant'よりもはるかにうまく機能しているようですnearest。sigma=2これは、最大のビン サイズの で右中央に収束します。

では、最後の画像に示されている最大値の座標を取得するにはどうすればよいでしょうか?

