現在、データベースに値を照会し、それらをグラフにプロットする方法があります。唯一の問題は、time変数が長いため、グラフが次のようになることです。
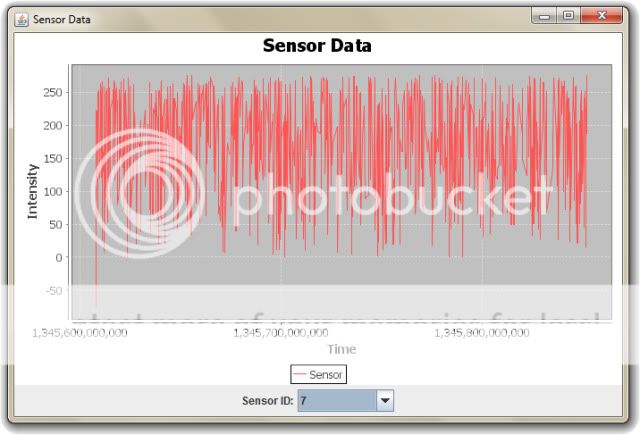
日付形式に変換してグラフに追加したい。
これどうやってするの?
ここに私のグラフコードがあります:
private Long time;
private Long intensity;
public XYSeries series = new XYSeries("Sensor");
private XYDataset xyDataset;
public JFreeChart chart;

xyDataset = new XYSeriesCollection(series);
chart = ChartFactory.createXYLineChart("Sensor Data", "Time", "Intensity", xyDataset, PlotOrientation.VERTICAL, true, true, false);
グラフに追加するための私の方法は次のとおりです。
public void GetDustLevels() {
    series.clear();
    try {
        currentSensor = Application.getInstance().getMinesite().getSensors().get(sensorID);
    } catch (Exception e1) {
        e1.printStackTrace();
    }

    if (currentSensor != null) {
        sensorKDTree = currentSensor.getSensorData();
        Iterator<Map.Entry<GenericPoint<Long>, String>> allPoints = sensorKDTree.iterator(sensorKDTree.getMin(null), sensorKDTree.getMax(null));

        while (allPoints.hasNext()) {
            GenericPoint<Long> timeIntensityPair = allPoints.next().getKey();
            time = timeIntensityPair.getCoord(0);
            intensity = timeIntensityPair.getCoord(1);
            System.out.println("CURRENT SENSOR" + currentSensor);
            System.out.println("TIME: " + time + " " + "INTENSITY: " + intensity);
            series.add(time, intensity);
        }

    }


}
どんな助けでも大歓迎です!ありがとうございました!
編集:コードを次のように変更しました:
public TimeSeries series = new TimeSeries("Sensor", Date.class);
public JFreeChart chart;
private Long time;
private Long intensity;

TimeSeriesCollection xyDataset = new TimeSeriesCollection(series);
chart = ChartFactory.createTimeSeriesChart("Sensor Data", "Time", "Intensity", xyDataset, true, true, false);
そして、私の新しい GetDustLevels() メソッド:
 public void GetDustLevels() {
    series.clear();
    try {
        currentSensor = Application.getInstance().getMinesite().getSensors().get(sensorID);
    } catch (Exception e1) {
        e1.printStackTrace();
    }

    if (currentSensor != null) {
        sensorKDTree = currentSensor.getSensorData();
        Iterator<Map.Entry<GenericPoint<Long>, String>> allPoints = sensorKDTree.iterator(sensorKDTree.getMin(null), sensorKDTree.getMax(null));

        while (allPoints.hasNext()) {
            GenericPoint<Long> timeIntensityPair = allPoints.next().getKey();
            time = timeIntensityPair.getCoord(0);
            intensity = timeIntensityPair.getCoord(1);
            System.out.println("CURRENT SENSOR" + currentSensor);
            System.out.println("TIME: " + time + " " + "INTENSITY: " + intensity);
            XYPlot plot = (XYPlot) chart.getPlot();
            DateAxis axis = (DateAxis) plot.getDomainAxis();
            axis.setDateFormatOverride(new SimpleDateFormat("dd-MMM-yyyy"));
            series.add(new Date(time.longValue()), intensity);
        }

    }


}