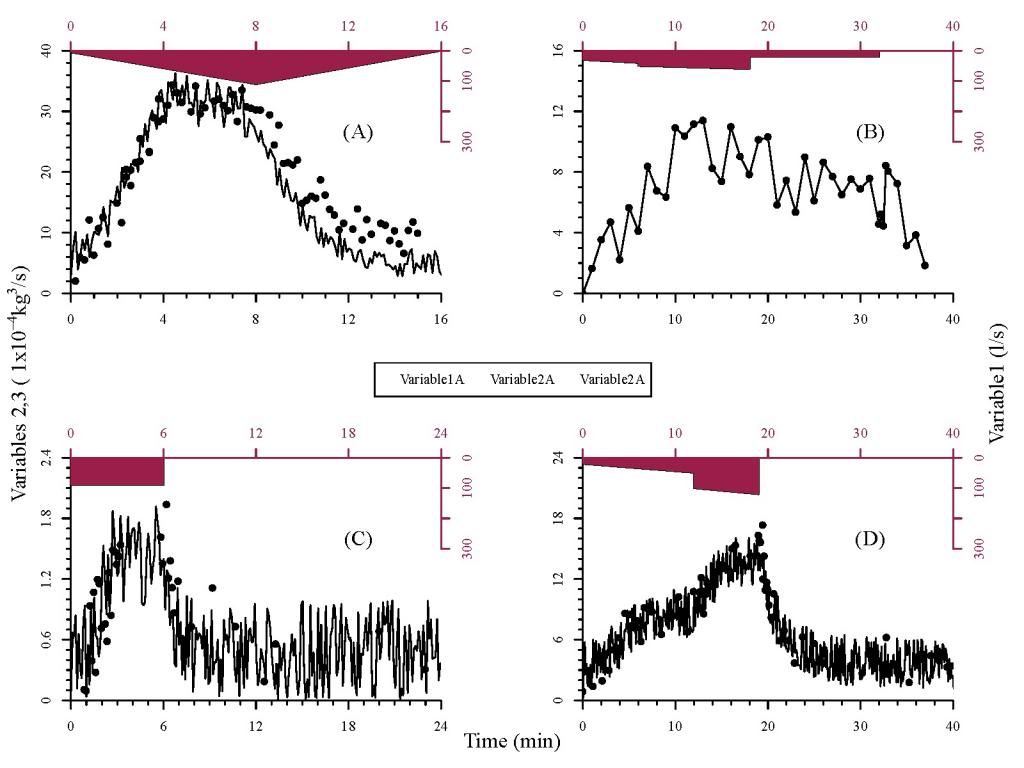
You ask many questions in the same OP. I will try to answer to just one : How to simplify your code or rather how to call it once for each letter. I think it is better to put your data in the long format. For example, This will create a list of 4 elements
ll <- lapply(LETTERS[1:4],function(let){
  dat.let <- dat[,grepl(let,colnames(dat))]
  dd <- reshape(dat.let,direction ='long',
                v.names=c('TimeVariable','Variable'),
                varying=1:6)
  dd$time <- factor(dd$time)
  dd$Type <- let
  dd
}
)
ll is a list of 4 data.frame, where each one that looks like :
head(ll[[1]])
 time TimeVariable Variable id Type
1.1    1            0        0  1    A
2.1    1            0        5  2    A
3.1    1            8      110  3    A
4.1    1           16        0  4    A
5.1    1           NA       NA  5    A
6.1    1           NA       NA  6    A
Then you can use it like this for example :
library(Hmisc)
layout(matrix(1:4, 2, 2, byrow = TRUE))
lapply(ll,function(data){
  label1=c(0,100,200,300)
  Type <- unique(dat$Type)
  dat <- subset(data,time==2)
  x.mm <- max(dat$Variable,na.rm=TRUE)
  plot(dat$TimeVariable,dat$Variable,axes=FALSE,ylab="",xlab="",xlim=c(0,x.mm),
       ylim=c(0,2.4),xaxs="i",yaxs="i",pch=19)
  dat <- subset(data,time==2)
  lines(dat$TimeVariable,dat$Variable)
  axis(2,tick=T,at=seq(0.0,2.4,by=0.6),label= seq(0.0,2.4,by=0.6))
  axis(1,tick=T,at=seq(0,x.mm,by=6),label=seq(0,x.mm,by=6))
  mtext(Type,side=1,outer=F,line=-10,adj=0.8)
  minor.tick(nx=5,ny=5)
  par(new=TRUE)
  dat <- subset(data,time==1)
  plot(dat$TimeVariable,dat$Variable,axes=FALSE,xlab="",ylab="",type="l",
       ylim=c(800,0),xaxs="i",yaxs="i")
  axis(3,xlim=c(0,24),tick=TRUE,at= seq(0,24,by=6),label=seq(0,24,by=6),col.axis="violetred4",col="violetred4")
  axis(4,tick=TRUE,at= label1,label=label1,col.axis="violetred4",col="violetred4")
  polygon(dat$TimeVariable,dat$Variable,col='violetred4',border=NA)
})
Another advantage of using the long data format is to use ``ggplot2andfacet_wrap` for example .
 ## transform your data to a data.frame
 dat.l <- do.call(rbind,ll)
 library(ggplot2)
 ggplot(subset(dat.l,time !=1)) +
  geom_line(aes(x=TimeVariable,y=Variable,group=time,color=time))+
  geom_polygon(data=subset(dat.l,time ==1),
              aes(x=TimeVariable,y=60-Variable/10,fill=Type))+
  geom_line(data=subset(dat.l,time ==1),
               aes(x=TimeVariable,y=Variable,fill=Type))+
  facet_wrap(~Type,scales='free')


