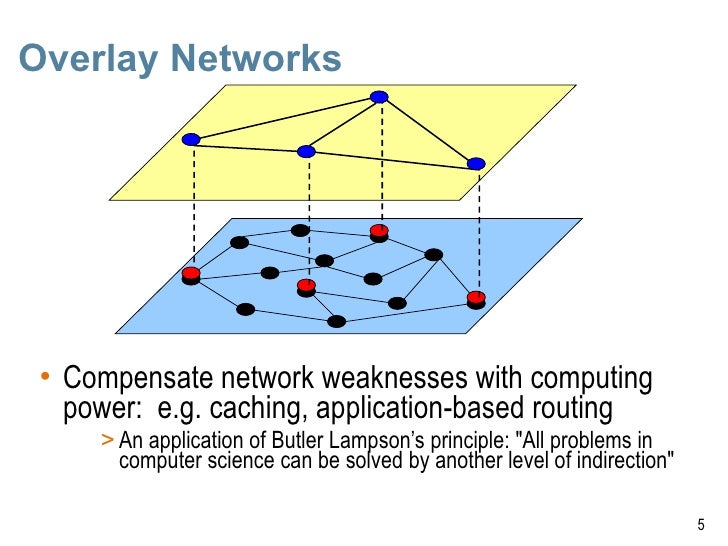
2 つの 2 次元散布図を 3 次元空間で重ね合わせて、対応する点をリンクできるようにしている図をときどき見かけます。多くの場合、これらは 2 つのネットワークがオーバーレイされたネットワークの形を取ります。例えば:
 参考:https ://satijalab.org/seurat/v3.0/pbmc3k_tutorial.html

次のようなプロットを得るために、2 次元プロットに共通の 3 次元を任意に追加できることを知っています。
from mpl_toolkits.mplot3d import Axes3D
import matplotlib.pyplot as plt
import numpy as np

def randrange(n, vmin, vmax):
    return (vmax - vmin)*np.random.rand(n) + vmin

n = 100

fig = plt.figure()
ax = fig.add_subplot(111, projection='3d')

xs = randrange(n, 23, 32)
ys = randrange(n, 0, 100)
zs = np.append(np.repeat(1, 50), np.repeat(2, 50))

for c, m in [('r', 'o'), ('b', '^')]:
     ax.scatter(xs, ys, zs, c=c, marker = m)

次に、関連するポイントを接続しますが、RまたはPythonでそのような画像を構築するより簡単な方法があると思いましたか?